立即注册找回密码

QQ登录

只需一步,快速开始

微信登录

微信扫一扫,快速登录

手机动态码快速登录

手机号快速注册登录

搜索

图文播报

查看: 346|回复: 5

[讨论] 如何从一个混合信号中分离出两个独立信号?

[复制链接]
发表于 2024-10-10 10:29 | 显示全部楼层 |阅读模式
回复

使用道具 举报

发表于 2024-10-10 10:29 | 显示全部楼层
文章来源:微信公众号:EW Frontier
关注可了解更多的雷达、通信、人工智能相关代码。问题或建议,请公众号留言;
今天介绍的ACMD自适应啁啾模态分解,可以应用与信号的分解、时频表示,可以实现故障的诊断与盲源分离等,感兴趣的小伙伴可以进行学习~
内容目录

摘要DOI主要原理主代码展示仿真结果
摘要

近年来提出的变分信号分解方法,如自适应线性调频模式分解(ACMD)和广义色散模式分解(GDMD)在各个领域引起了广泛的关注。然而,这些方法难以同时分离啁啾分量和色散分量。本文提出了一个变分广义非线性模式分解(VGNMD)框架来解决这个问题。VGNMD首先引入自适应时频融合与聚类(ATFFC)方法,提高噪声环境下信号时频分布(TFD)的抗噪性和分辨率,准确获取各模式的TFD。然后,模式类型的判别标准,建立了模式分为啁啾模式或色散模式的基础上,其时间-频率(TF)的脊。最后,以这些TF脊作为初始瞬时频率(IF)或初始群延迟(GD),应用变分优化算法精确重构模态并细化其IF或GD。仿真例子和实际应用蝙蝠回声定位信号分析和铁路轮轨故障诊断证明了VGNMD的有效性。结果表明,该方法可以同时准确地提取啁啾模和色散模,适用于分析具有不连续TF模式的非线性信号。
DOI

Detection of rub-impact fault for rotor-stator systems: A novel method based on adaptive chirp mode decomposition
https://doi.org/10.1016/j.jsv.2018.10.010
主要原理

对于旋转机械来说,旋转过程中转子和定子表面之间的摩擦冲击是一种常见且严重的故障。摩擦冲击故障将导致瞬时频率 (IF) 快速波动的调频 (FM) 振动信号 。由于当前时频(TF)方法的分辨率有限,很难提取快速波动的IF特征。最近提出的变分非线性啁啾模态分解(VNCMD)方法在分析强调频信号方面显示出明显的优势。然而,VNCMD解决了一个联合估计问题,该问题需要信号分量数量的先验信息,并可能导致不稳定问题。本文介绍了一种称为自适应啁啾模式分解(ACMD)的VNCMD的可处理版本,以提取摩擦冲击转子振动信号的快速波动IF。ACMD 采用贪婪算法来单独捕获每个信号分量。此外,利用ACMD估计的瞬时振幅和IF,我们得到了高分辨率的自适应TF谱,可以清楚地表示振动信号的摩擦冲击特征。首先通过动态仿真验证了基于ACMD的故障检测方法的有效性。然后,将该方法应用于某稠油催化裂化机组的振动信号,表明该方法在故障早期检测和多特征提取方面具有重要应用价值。
最近,文献[31]引入了一种强大的数据分析方法,称为变分非线性啁啾模态分解(VNCMD)。VNCMD是通过求解最优解调问题推导的,因此能够分析具有强FM特征的信号。最重要的是,VNCMD 直接在 TF 域中建模,它可以准确估计多分量 FM 信号的 IF 和瞬时幅度 (IA)。与 VMD 一样,VNCMD 通过联合优化技术同时估计所有信号分量。问题在于,必须事先知道信号底层分量的数量,并且联合估计方案在实际情况下可能不稳定,如参考文献[31]所述。该文介绍了一种可处理的VNCMD[32],称为自适应啁啾模态分解(ACMD),并提出了一种基于ACMD的摩擦冲击故障检测方法,用于估计振动信号的快速波动IF。ACMD采用类似于匹配追踪的贪婪算法[33\u201234],逐个递归估计信号分量。ACMD 更灵活,因为它需要更少的先验信息(例如,信号分量的数量)。此外,基于ACMD估计的IF和IA,我们得到了自适应TF频谱(ATFS),其分辨率比当前的TFD好得多。该故障检测方法的另一个重要优点是可以同时提取多个故障特征(如AM和FM),从而保证了更可靠的故障诊断。
其余文件的组织总结如下。在第 2 节中,在简要介绍了 VNCMD 之后,介绍了 ACMD。在第三节中,我们首先介绍了基于ACMD的摩擦断层特征提取方法,然后通过动态仿真验证了该方法的有效性。第4节介绍了所提出的故障检测方法的实际应用。最后,结论在第5节中得出。
主代码展示
  1. %%%%%%%%% instantaneous frequency initialization by detecting time-frequency ridge from STFT %%%%%%%%%%%%%%
  2. clc
  3. clear
  4. close all
  5. SampFreq = 500;
  6. t = 0:1/SampFreq:6;
  7. Sig1 = exp(-0.03*t).*cos(2*pi*(1.3+25*t + 4*t.^2 - 0.8*t.^3 + 0.07*t.^4));
  8. IF1 = 25 + 8*t - 2.4*t.^2 + 0.28*t.^3;
  9. Sig2 = 0.9*exp(-0.06*t).*cos(2*pi*(2.6+40*t + 8*t.^2 -1.6*t.^3 + 0.14*t.^4));
  10. IF2 = 40 + 16*t - 4.8*t.^2 + 0.56*t.^3;
  11. Sig3 = 0.8*exp(-0.09*t).*cos(2*pi*(3.9+60*t + 12*t.^2 -2.4*t.^3 + 0.21*t.^4));
  12. IF3 = 60 + 24*t - 7.2*t.^2 + 0.84*t.^3;
  13. Sig = Sig1 + Sig2 + Sig3;
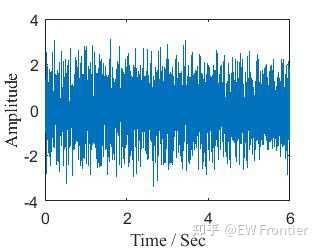
  14. STD = 0.5;
  15. noise = addnoise(length(Sig),0,STD);
  16. Sign = Sig + noise;
  17. figure
  18. set(gcf,'Position',[20 100 320 250]);        
  19. set(gcf,'Color','w');
  20. plot(t,Sign,'linewidth',1);
  21. xlabel('Time / Sec','FontSize',12,'FontName','Times New Roman');
  22. ylabel('Amplitude','FontSize',12,'FontName','Times New Roman');
  23. set(gca,'FontSize',12)
  24. set(gca,'linewidth',1);
  25. axis([0 6 -4 4])
  26. %% STFT
  27. Ratio = 0;
  28. figure
  29. [tfSpec1,f] = STFT(Sign',SampFreq,1024,256);%128
  30. imagesc(t,f,abs(tfSpec1));
  31. axis([0 6 0 150]);
  32. set(gcf,'Position',[20 100 320 250]);     
  33. xlabel('Time / Sec','FontSize',12,'FontName','Times New Roman');
  34. ylabel('Frequency / Hz','FontSize',12,'FontName','Times New Roman');
  35. set(gca,'YDir','normal')
  36. set(gca,'FontSize',12);
  37. set(gcf,'Color','w');   
  38. %% parameter setting
  39. alpha0 = 1e-6; % or 1e-3  %or alpha = 2e-4; % if this parameter is larger, it will help the algorithm to find correct modes even the initial IFs are too rough. But it will introduce more noise and also may increase the interference between the signal modes
  40. beta = 1e-9; % 0.5e-4  this parameter can be smaller which will be helpful for the convergence, but it may cannot properly track fast varying IFs
  41. delta = 20; % control parameter for ridge detection
  42. tol = 1e-8;%
  43. %% Component 1 extraction
  44. index1 = findridges(tfSpec1,delta); % Time-frequency ridge detection
  45. iniIF1 = curvesmooth(f(index1),beta); % the initial guess for the IFs by ridge detection; the initial IFs should be smooth and thus we smooth the detected ridges
  46. [IFest1 IAest1 sest1] = ACMD(Sign,SampFreq,iniIF1,alpha0,beta,tol); % extract the signal component and its IA and IF
  47. %% Component 2 extraction
  48. residue1 = Sign - sest1; % obtain the residual signal by removing the extracted component from the raw signal
  49. [tfSpec2,f] = STFT(residue1',SampFreq,1024,256); % STFT of the residual signal
  50. index2 = findridges(tfSpec2,delta); % IF initialization by finding ridge curve of the STFT of the residue signal
  51. iniIF2 = curvesmooth(f(index2),beta); % smooth the ridge curve
  52. [IFest2 IAest2 sest2] = ACMD(residue1,SampFreq,iniIF2,alpha0,beta,tol); % extract the component 2 and its IA and IF from the residue signal
  53. %% Component 3 extraction
  54. residue2 = residue1 - sest2; % obtain the residual signal by removing the extracted component
  55. [tfSpec3,f] = STFT(residue2',SampFreq,1024,256); % STFT of the residual signal
  56. index3 = findridges(tfSpec3,delta); % IF initialization by finding ridge curve of the STFT of the residue signal
  57. iniIF3 = curvesmooth(f(index3),beta); % smooth the ridge curve
  58. [IFest3 IAest3 sest3] = ACMD(residue2,SampFreq,iniIF3,alpha0,beta,tol); % extract the component 2 and its IA and IF from the residue signal
  59. %% initial IF
  60. figure
  61. plot(t,[IF1;IF2;IF3],'k','linewidth',3) % true IFs
  62. hold on
  63. plot(t,[iniIF1;iniIF2;iniIF3],'r--','linewidth',3) % initial IFs
  64. set(gcf,'Position',[20 100 640 500]);     
  65. xlabel('Time / Sec','FontSize',24,'FontName','Times New Roman');
  66. ylabel('Frequency / Hz','FontSize',24,'FontName','Times New Roman');
  67. set(gca,'YDir','normal')
  68. set(gca,'FontSize',24);
  69. set(gca,'linewidth',2);
  70. set(gca,'FontName','Times New Roman')
  71. set(gcf,'Color','w');   
  72. axis([0 6 0 150]);
  73. %% estimated IF
  74. figure
  75. plot(t,[IF1;IF2;IF3],'k','linewidth',3) % true IFs
  76. hold on
  77. plot(t,[IFest1;IFest2;IFest3],'r--','linewidth',3) % finally estimated IFs
  78. set(gcf,'Position',[20 100 640 500]);     
  79. xlabel('Time / Sec','FontSize',24,'FontName','Times New Roman');
  80. ylabel('Frequency / Hz','FontSize',24,'FontName','Times New Roman');
  81. set(gca,'YDir','normal')
  82. set(gca,'FontSize',24);
  83. set(gca,'linewidth',2);
  84. set(gca,'FontName','Times New Roman')
  85. set(gcf,'Color','w');   
  86. axis([0 6 0 150]);
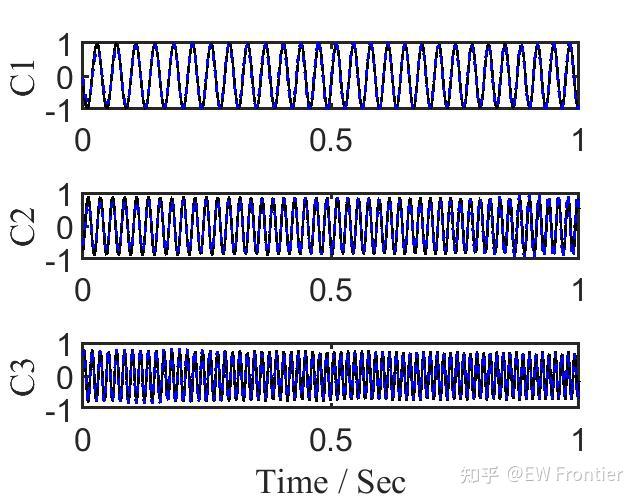
  87. %% Reconstructed modes
  88. figure
  89. set(gcf,'Position',[20 100 640 500]);      
  90. subplot(3,1,1)
  91. set(gcf,'Color','w');
  92. plot(t,Sig1,'k','linewidth',2) % true signal mode
  93. hold on
  94. plot(t,sest1,'b--','linewidth',2)    % estimated mode
  95. ylabel('C1','FontSize',24,'FontName','Times New Roman');set(gca,'YDir','normal')
  96. set(gca,'FontSize',24);
  97. set(gca,'linewidth',2);
  98. axis([0 1 -1 1])
  99. subplot(3,1,2)   
  100. set(gcf,'Color','w');
  101. plot(t,Sig2,'k','linewidth',2)
  102. hold on
  103. plot(t,sest2,'b--','linewidth',2)    % estimated mode
  104. ylabel('C2','FontSize',24,'FontName','Times New Roman');
  105. set(gca,'YDir','normal')
  106. set(gca,'FontSize',24);
  107. set(gca,'linewidth',2);   
  108. axis([0 1 -1 1])
  109. subplot(3,1,3)   
  110. set(gcf,'Color','w');
  111. plot(t,Sig3,'k','linewidth',2)
  112. hold on
  113. plot(t,sest3,'b--','linewidth',2)    % estimated mode
  114. ylabel('C3','FontSize',24,'FontName','Times New Roman');
  115. xlabel('Time / Sec','FontSize',24,'FontName','Times New Roman')
  116. set(gca,'YDir','normal')
  117. set(gca,'FontSize',24);
  118. set(gca,'linewidth',2);   
  119. axis([0 1 -1 1])
  120. %% adaptive time-frequency spectrum
  121. band = [0 SampFreq/2];
  122. IFmulti = [IFest1;IFest2;IFest3];
  123. IAmulti = [IAest1;IAest2;IAest3];
  124. [ASpec fbin] = TFspec(IFmulti,IAmulti,band);
  125. figure
  126. imagesc(t,fbin,abs(ASpec));
  127. axis([0 6 0 150]);
  128. set(gcf,'Position',[20 100 640 500]);     
  129. xlabel('Time / Sec','FontSize',24,'FontName','Times New Roman');
  130. ylabel('Frequency / Hz','FontSize',24,'FontName','Times New Roman');
  131. set(gca,'YDir','normal')
  132. set(gca,'FontSize',24);
  133. set(gcf,'Color','w');   
  134. colorbar('YTickLabel',{' '})
  135. %% SNR of the reconstructed signal mode
  136. SNR1 = SNR(Sig1,sest1) %
  137. SNR2 = SNR(Sig2,sest2)
  138. SNR3 = SNR(Sig3,sest3)
  139. %% Relative errors of the initial IFs
  140. iniRE1 =  norm(iniIF1-IF1)/norm(IF1)
  141. iniRE2 =  norm(iniIF2-IF2)/norm(IF2)
  142. iniRE3 =  norm(iniIF3-IF3)/norm(IF3)
  143. %% Relative errors of the finally estimated IFs
  144. RE1 =  norm(IFest1-IF1)/norm(IF1)   % one can find that the accuracy of the finally estimated IFs is significantly improved compared with the initial IFs (by ridge detection) whose accuracy is limited by the resolution of the TFR.
  145. RE2 =  norm(IFest2-IF2)/norm(IF2)
  146. RE3 =  norm(IFest3-IF3)/norm(IF3)
  147. %%%%% In practice, the above procedure can be executed iteratively until the energy of the residual signal is smaller than a threshold
复制代码
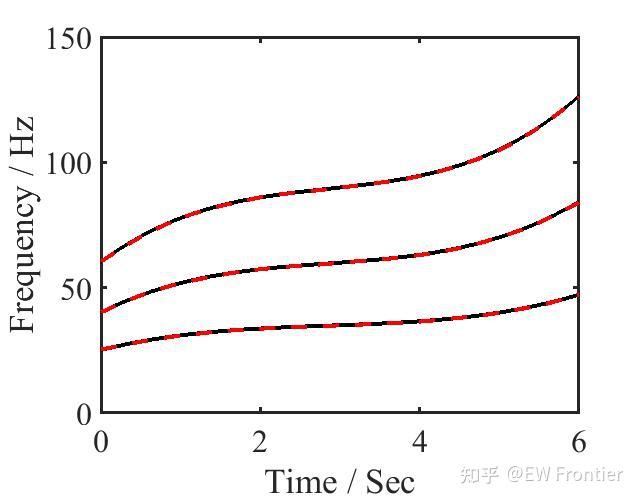
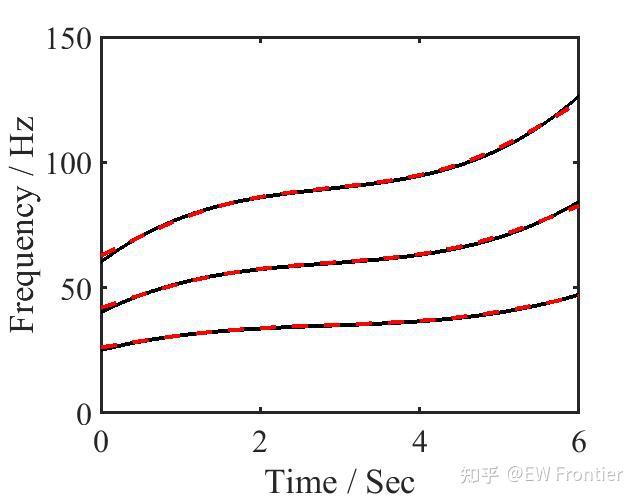
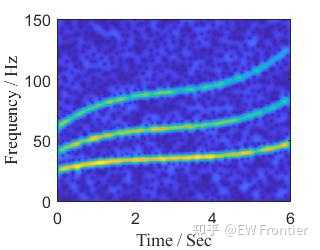
仿真结果


回复 支持 反对

使用道具 举报

发表于 2024-10-10 10:29 | 显示全部楼层
可以试试singular value decomposition SVD,Matlab可以直接调用函数。
回复 支持 反对

使用道具 举报

发表于 2024-10-10 10:30 | 显示全部楼层
最怕这种问题,什么场景都没说清楚,上来就找答案,想解决问题的人是无法下手的。
现实中并不存在一种通用技术,能够无条件地分开两个信号。
分开信号的手段一般有时分,频分,码分和空分等。
在这个问题中可以考虑的是空分,也就是两个信号源位于不同的方向上,接收端可以采用接收阵列分别恢复出两个信号。
还有一个可以考虑的方向是维纳滤波,这个需要信号源的二阶统计特性,这样可以分别分离出这两个信号。
维纳滤波器有非常广泛的应用,在医疗上,从母亲和胎儿的混合心跳信号中分离出胎儿的心跳信号就是用维纳滤波器来实现的。
维纳滤波的基本原理是:设观察信号y(t)含有彼此统计独立的期望信号x(t)和白噪声ω(t)可用维纳滤波从观察信号y(t)中恢复期望信号x(t)。设线性滤波器的冲击响应为h(t),此时其输入y(t)为y(t)=x(t)+w(t),输出为\n\n从而,可以得到输出对x(t)期望信号的误差为\n\n其均方误差为:\n\nE[ ]表示数学期望。应用数学方法求最小均方误差时的线性滤波器的冲击响应hopt(t)可得方程:\n\n式中,Ryx(t)为y(t)与x(t)的互相关函数,Ryy(τ-σ)为y(t)的自相关函数。上述方程称为维纳-霍夫(Wiener-Hopf)方程。求解维纳-霍夫方程可以得到最佳滤波器的冲击响应hopt(t)。
回复 支持 反对

使用道具 举报

发表于 2024-10-10 10:30 | 显示全部楼层
模态分解系列,盲源分离系列算法都可以试试,但效果真不好说。
我在说一个理论基础比较强的算法吧:Void-Kalman滤波方法
1993 年, VOLD 和 LEURIDAN 以现代控制理论中的卡尔曼滤波原理为理论基础, 提出了 Vold -Kalman 跟踪滤波方法, 开创了在时域中直接提取阶比分量的先河,Vold-Kalman阶次追踪可以提取多个阶次分量,其解耦临近和交叉阶次的准确性也较好,在很多领域得到了广泛应用。


         为了追踪目标阶次的信号,构建状态方程和观测方程,信号模型用幅值和载波乘积的形式表达,通过求得的包络幅值重构阶次信号。将阶次信号模型表示为幅值和载波的乘积:


先通过向前分解求出z,再通过向后代入求a,由此完成对包含多重分量复杂信号的阶比分量提取。提取出的单个阶比的信号往往可以对应到分析场中的局部特征,通过对阶比信号追踪分析,就可对信号的各个子特征进行识别。
首先导入相关模块
  1. import numpy as np
  2. from scipy import sparse
  3. from scipy.linalg import pascal
  4. from scipy.sparse import linalg
  5. import matplotlib.pyplot as plt
  6. import time
复制代码
定义Void-Kalman函数
  1. def vkf(y,fs,f,p=None,bw=None,multiorder=None,solver='scipy-spsolve'):
  2.     """
  3.     参数
  4.     ----------
  5.     y : 输入信号
  6.     fs :采样频率
  7.     f : 信号y的频率序列[f_1,...,f_K]
  8.     p : p 阶滤波器(通常在 1 或 4 之间)
  9.     bw : 带宽,默认为bw=fs/100
  10.     multiorder : 算法的阶数
  11.     solver : 'scikits-spsolve' (faster) or 'scipy-spsolve' (slower)
  12.     返回值
  13.     -------
  14.     x : 复包络
  15.     c : 相位  
  16.     """
  17.    
  18.     if type(p)==type(None):
  19.         p = 2#Default filter order
  20.     if type(bw) ==type(None):
  21.         bw = fs/100   #Default bandwidth: 0.01*fs
  22.     if type(multiorder)==type(None):
  23.         multiord = True   #Default single-order algorithm
  24.     else:
  25.         multiord = multiorder
  26.     silent=False
  27.     if len(np.array(y).shape)>1:
  28.         if np.array(y).shape[1] > np.array(y).shape[0]:   
  29.             y = np.transpose(np.array(y))
  30.     else:
  31.         y = np.array(y)
  32.     if np.size(bw)!=1:   
  33.         if np.array(bw).shape[1] > np.array(bw).shape[0]:
  34.             bw = np.transpose(np.array(bw))
  35.         else:
  36.             bw = np.array(bw)
  37.     if silent ==False:
  38.         print('preparing array ok')
  39.     #Signal
  40.     n_t = len(y)
  41.    
  42.     #频率向量
  43.     (n_f, n_ord) = f.shape
  44.     if n_f == 1:
  45.         f1 = np.ones(n_t,1)*f
  46.         raise Warning('error:', f1)
  47.     elif n_f != n_t:
  48.         raise Warning('The array in f should have 1 or {} elements.'.format(n_t))
  49.    
  50.     #将频率向量转换为相位向量
  51.     c = np.exp(2j*np.pi*np.cumsum(f,axis=0)/fs)
  52.     #带宽向量
  53.     n_bw = np.size(bw)
  54.     if n_bw == 1:
  55.         bw = np.ones((n_t,1))*bw
  56.     elif n_bw != n_t:
  57.         raise Warning('The array bw should have 1 or {} elements.'.format(n_t))
  58.    
  59.     #以弧度为单位的相对带宽
  60.     phi = np.pi/fs*bw
  61.     #滤波器阶数
  62.     p_tmp = p
  63.     if np.size(p)>1:
  64.         p = max(p)
  65.     p_lo = np.setdiff1d(p_tmp,p)
  66.      
  67.     #构造滤波器矩阵和带宽向量
  68.     P_lu = pascal(p+1,kind='lower',exact=True)
  69.     signalt = np.empty((p+1,))
  70.     signalt[::2] = 1
  71.     signalt[1::2] = -1
  72.     coeffs = P_lu[-1,:]*signalt
  73.     #差分方程的线性系统
  74.     A = sparse.spdiags((np.ones((n_t,1))*coeffs).transpose(),np.arange(0,p+1),n_t-p,n_t)
  75.     #引入低阶方程以将边界条件设置为零
  76.     pp = np.size(p_lo)
  77.     A_pre = sparse.csr_matrix((pp,n_t), dtype=None) #sparse(pp,n_t)
  78.     A_pre[:,0:p+1] = P_lu[p_lo,0:p+1]
  79.     A = sparse.vstack([A_pre, A, A_pre[-1::-1,-1::-1]])
  80.    
  81.    
  82.     s = np.arange(0,p+1)
  83.     sgn = np.power(-1,s)
  84.    
  85.     Q = np.zeros((p+1,p+1))
  86.     b = np.zeros((p+1,1))
  87.    
  88.     Q[0,:] = np.ones((p+1))
  89.     b[0] = 2**(2*p-1)
  90.    
  91.     for i in range(0,p):
  92.         Q[i+1,:] = np.power(s,(2*(i))) * sgn
  93.    
  94.     q = np.linalg.solve(Q,b).transpose()*sgn
  95.     num = np.sqrt(2)-1
  96.     den = np.zeros((np.size(bw),1))
  97.     for qi in range(0,np.size(q)):
  98.         den = den + 2*q[0,qi]*np.cos((qi)*phi)
  99.     r = np.sqrt(num/den)
  100.     if (den <= 0).any() | (r > (np.sqrt(1/(2*q[0,0]*np.finfo(float).eps)))).any():
  101.         raise Warning('Ill-conditioned B-matrix selectivity bandwidth is too small.')
  102.     R = sparse.spdiags(r.transpose(),0,n_t,n_t)
  103.     B = (A.dot(R)).transpose().dot(A.dot(R)) + sparse.eye(n_t)
  104.     del A, A_pre, R, bw, phi, num, den, f
  105.    
  106.    
  107.     if multiord:
  108.         nn = n_t*n_ord
  109.         diags = list(range(-p,p+1))
  110.         diags_B = np.zeros((B.shape[0],len(diags)))
  111.         for i in range(0,len(diags)):
  112.             if diags[i]==0:
  113.                 diags_B[:,i] = B.diagonal(diags[i])
  114.             elif diags[i]>0:
  115.                 diags_B[:-diags[i],i] = B.diagonal(diags[i])
  116.             elif diags[i]<0:
  117.                 diags_B[:diags[i],i] = B.diagonal(diags[i])
  118.         diags_B_r= np.tile(diags_B.T,(1,n_ord))
  119.         BB_D = sparse.diags(diags_B_r,diags,shape=(nn,nn))
  120.         bl_U = int((n_ord**2 - n_ord)/2)
  121.         ii_U = np.zeros((n_t,bl_U))
  122.         jj_U = np.zeros((n_t,bl_U))
  123.         cc_U = np.zeros((n_t,bl_U),dtype = np.float64)
  124.         m = 0
  125.         
  126.         for ki in range(0,n_ord):
  127.             for kj in range((ki+1),n_ord):
  128.                 ii_U[:,m] = (ki)*n_t + np.arange(0,n_t)
  129.                 jj_U[:,m] = (kj)*n_t + np.arange(0,n_t)
  130.                 cc_U[:,m] = np.real(np.conj(c[:,ki])*c[:,kj])
  131.                 m = m + 1
  132.         BB_U = sparse.csr_matrix((cc_U.flatten(),(ii_U.flatten(),jj_U.flatten())),shape=(nn,nn))
  133.         
  134.         BB = BB_D + BB_U + BB_U.transpose()
  135.         cy = (np.conj(c.T.reshape(-1,1)).T*np.tile(y,(n_ord))).T
  136.         del diags_B, B, BB_D, BB_U, ii_U, jj_U, cc_U   
  137.    
  138.    
  139.     if silent==False:
  140.         print('Solving sparse Ax=b, as single precision complex')
  141.     if multiord:
  142.         if solver=='scikits-spsolve':
  143.             from scikits import umfpack
  144.             xx = 2 * umfpack.spsolve(BB,cy)
  145.         else:
  146.             xx = linalg.spsolve(BB,cy,use_umfpack=False)
  147.         # xx = bicg(BB,cy)
  148.         x = 2 * xx.reshape(n_ord,-1).T  
  149.     else:
  150.         x = np.zeros((n_t,n_ord),dtype=np.complex64)
  151.         for ki in range(0,n_ord):
  152.             cy_k = np.conj(c[:,ki])*y
  153.             if solver=='scikits-spsolve':
  154.                 from scikits import umfpack
  155.                 x[:,ki] = 2 * umfpack.spsolve(B,cy_k)
  156.             else:
  157.                 print('dtype B: ',B.dtype)
  158.                 # x[:,ki] = 2 * linalg.lgmres(B,cy_k)
  159.                 x[:,ki] = 2 * linalg.spsolve(B,cy_k,use_umfpack=False)
  160.    
  161.     return x,c,r
  162. def lil_repeat(S, repeat):
  163.    
  164.     shape=list(S.shape)
  165.     if isinstance(repeat, int):
  166.         shape[0]=shape[0]*repeat
  167.     else:
  168.         shape[0]=sum(repeat)
  169.     shape = tuple(shape)
  170.     new = sparse.lil_matrix(shape, dtype=S.dtype)
  171.     new.data = S.data.repeat(repeat) # flat repeat
  172.     new.rows = S.indices.repeat(repeat)
  173.     return new
复制代码
下面进行验证,首先设置一些基本参数,例如采样频率,时间项等
  1. fs = 12000
  2. T = 50
  3. dt = 1/fs
  4. t = np.linspace(0,(T),np.int64((T-dt)/dt+1)).transpose()
  5. N = t.size
复制代码
然后构造第1个非平稳成分
  1. A0 = 2*np.hstack([np.linspace(0.5,1,np.floor(N/2).astype(np.int64())), np.linspace(1,0.5,np.ceil(N/2).astype(np.int64()))])
  2. f0 = (0.2*fs - 0.1*fs*np.cos(4*np.pi*t/T)).reshape(-1,1)
  3. phi0 = 2*np.pi*np.cumsum(f0)*dt+3*t/max(t)
  4. y0 = A0*np.cos(phi0)
复制代码
构造第2个非平稳成分
  1. A1 = np.hstack([np.linspace(0.5,1,np.floor(N/2).astype(np.int64())), np.linspace(1,0.5,np.ceil(N/2).astype(np.int64()))])
  2. f1 = (0.2*fs - 0.1*fs*np.cos(np.pi*t/T)).reshape(-1,1)
  3. phi1 = 2*np.pi*np.cumsum(f1)*dt
  4. y1 = A1*np.cos(phi1)
复制代码
构造第3个非平稳成分
  1. As1 = np.ones(N)
  2. fs1 = 0.2*fs*np.ones((N,1))
  3. phis1 = 2*np.pi*np.cumsum(fs1)*dt
  4. ys1 = As1*np.sin(phis1)
复制代码
加点白噪声干扰
  1.     e = 1.5*np.random.rand(np.size(y1))
复制代码
构造试验用复合信号
  1.     y = y0+ y1 + ys1 + e
复制代码
执行Void-Kalman滤波
  1. p = 2
  2. bw = fs/12000
  3. t1=time.time()
  4. (x,c,r) = vkf(y,fs,np.hstack([f0, f1, fs1]),p=p,bw=bw)
  5. print('elaspsed time: {}'.format(time.time()-t1))
  6. xreal = np.real(x*c)
复制代码
显示白噪声
  1. w = y-np.sum(xreal,1)
复制代码
幅值与相位
  1. Amplitude = np.abs(x)
  2. Phase = np.log(x).imag
复制代码
作图
  1. fig,ax = plt.subplots(nrows=3)
  2. ax[0].specgram(y,round(fs/16),Fs=fs)
  3. ax[1].plot(t,np.vstack((A0,A1,As1)).T,'--')
  4. ax[1].plot(t,Amplitude)
  5. ax[1].set_xlim([min(t),max(t)])
  6. ax[2].plot(t,Phase)
  7. ax[2].set_xlim([min(t),max(t)])
  8. ax[2].set_xlabel('Time (s)')
  9. ax[1].set_ylabel('Amplitude')
  10. ax[2].set_ylabel('Phase')
  11. ax[1].legend(['S1','S2','Ss1'],loc='upper right')
  12. ax[2].legend(['S1','S2','Ss1'],loc='upper right')
  13.   
复制代码
回复 支持 反对

使用道具 举报

发表于 2024-10-10 10:31 | 显示全部楼层
既然满足两个信号是独立,那就可以分离,盲源分离就是讨论这个问题,既然你只有一路混合信号,你需要将其分解,比如用EMD,小波分解等,构造出混合矩阵后再进行盲源分离(ICA等算法)。
回复 支持 反对

使用道具 举报

发表回复

您需要登录后才可以回帖 登录 | 立即注册 微信登录 手机动态码快速登录

本版积分规则

关闭

官方推荐 上一条 /3 下一条

快速回复 返回列表 客服中心 搜索 官方QQ群 洽谈合作
快速回复返回顶部 返回列表